27장 observability와 장애 진단을 증거 순서로 훈련한다
EKS control plane logging은 API server, audit, authenticator, controller manager, scheduler log를 CloudWatch로 보낸다. 기본적으로 자동 전송되지 않으므로 필요한 type과 retention을 cluster 생성 때 선언한다. log ingestion과 storage 비용을 함께 추적한다.
application은 최소 다음 신호를 남긴다.
- request count·error rate·latency
- Pod restart·readiness failure·OOMKill
- desired/ready replica와 HPA 상태
- node provisioning·Pending Pod 이유
- ALB target health·5xx·response time
- release version·commit·deploy time
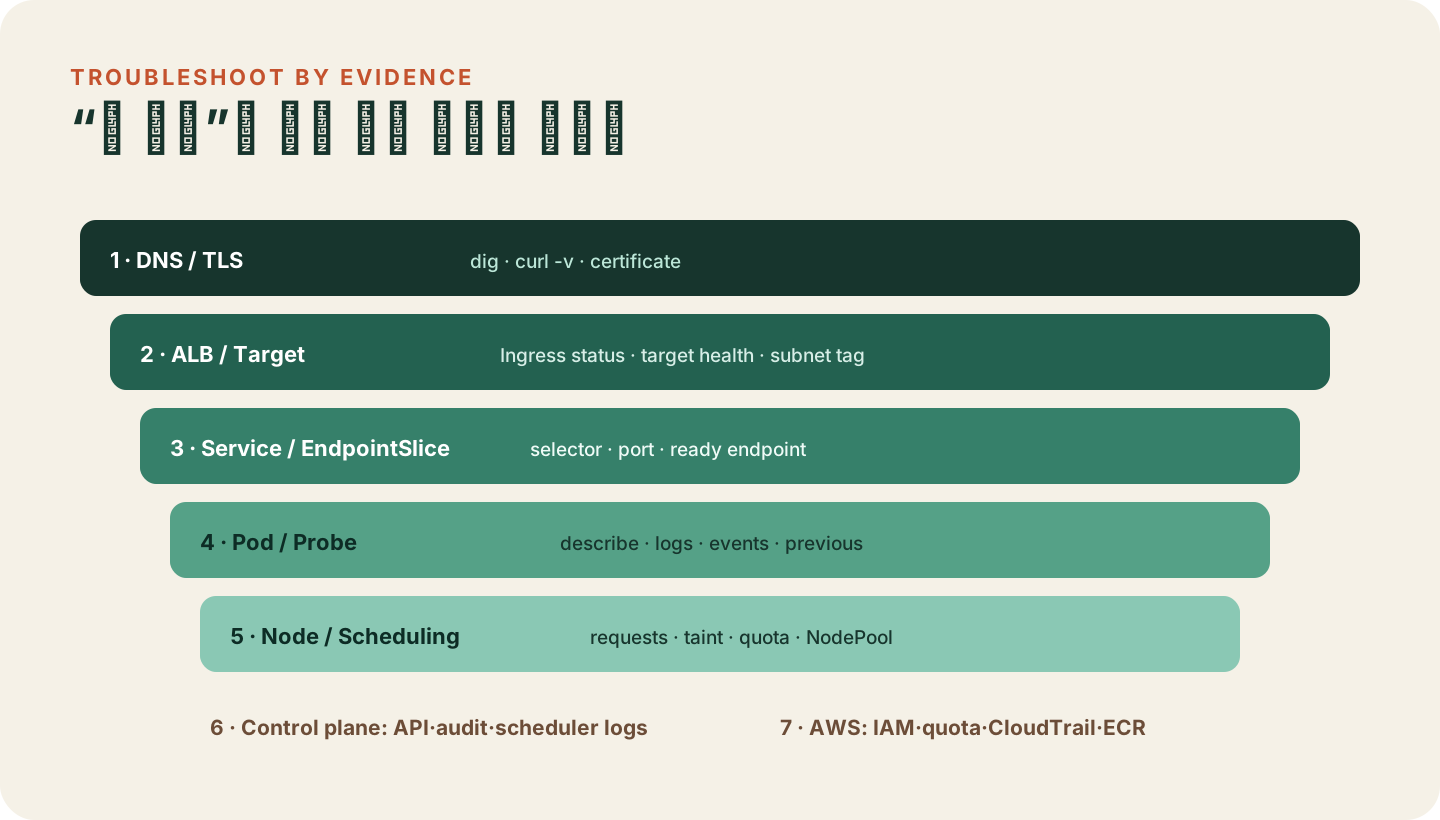
진단 runbook의 첫 묶음이다.
kubectl -n flownote get deployment,pod,service,endpointslice,ingress -o wide
kubectl -n flownote describe deployment flownote
kubectl -n flownote get events --sort-by=.lastTimestamp | tail -40
kubectl -n flownote logs deployment/flownote --all-pods --tail=100
kubectl -n flownote logs POD_NAME --previous --tail=100
kubectl get nodes
kubectl get nodepool
대표 증상을 경계로 분리한다.
| 증상 | 먼저 볼 증거 | 흔한 원인 |
|---|---|---|
ImagePullBackOff |
Pod event·ECR URI | tag 오타·permission·network |
CrashLoopBackOff |
current/previous log | process exit·config·liveness |
Pending |
scheduler event | request·quota·taint·capacity·IP |
| ALB 503 | target health·EndpointSlice | readiness·selector·port |
AccessDenied |
caller identity·CloudTrail | wrong role·permission scope |
Unauthorized kubectl |
kubeconfig·Access Entry | identity가 cluster access 없음 |
| rollout timeout | new ReplicaSet·probe | bad image·startup·quota |